Network Security Monitoring Lab
A Blue Team home lab for packet capture, intrusion detection, protocol analysis, and flow analytics.
Introduction
After earning the SANS GCIA (GIAC Certified Intrusion Analyst), I wanted to continue developing the network analysis skills covered in the course by building a home lab that resembles an enterprise network security monitoring (NSM) environment.
While I initially experimented with Security Onion (which is an excellent platform), I realized I wanted a better understanding of how the individual components work together. The lab I built provides full packet capture, intrusion detection, protocol analysis, and flow analytics using individual open-source components.
Rather than deploying a single appliance, I decided to build the monitoring pipeline myself. After several weekends of troubleshooting, rebuilding configurations, and validating data at each stage, I now have an open source NSM platform that I can use for incident response practice, malware analysis, threat hunting, and future Blue Team projects.
Lab Specifications
| Component | Technology |
|---|---|
| Hypervisor | Proxmox VE 9.2 |
| Sensor OS | Ubuntu 26.04 LTS |
| Packet Capture | Arkime |
| IDS | Suricata |
| Protocol Analysis | Zeek |
| Flow Analytics | SiLK + YAF |
| Traffic Mirroring | Open vSwitch |
| Attacker VM | Kali Linux |
| Target VM | Metasploitable 2 |
| Packet Storage | 4 TB External SSD |
Goals
My objectives for this lab were to:
- Capture 100% of network traffic
- Preserve packets for forensic analysis
- Generate IDS alerts
- Create protocol metadata
- Generate flow records
- Correlate alerts, packets, protocol metadata, and flow records during investigations
- Build a platform for future malware analysis and incident response exercises
- Gain practical experience with tools encountered in enterprise SOC environments
Lab Architecture
I host the lab environment on a Proxmox virtualization server running on a repurposed System76 Pangolin 10 laptop upgraded with additional memory.
The lab consists of:
- Proxmox Virtual Environment
- Kali Linux (attacker)
- Metasploitable 2 (target)
- Ubuntu NSM sensor
- Open vSwitch traffic mirroring
- A 4 TB external drive for full packet capture
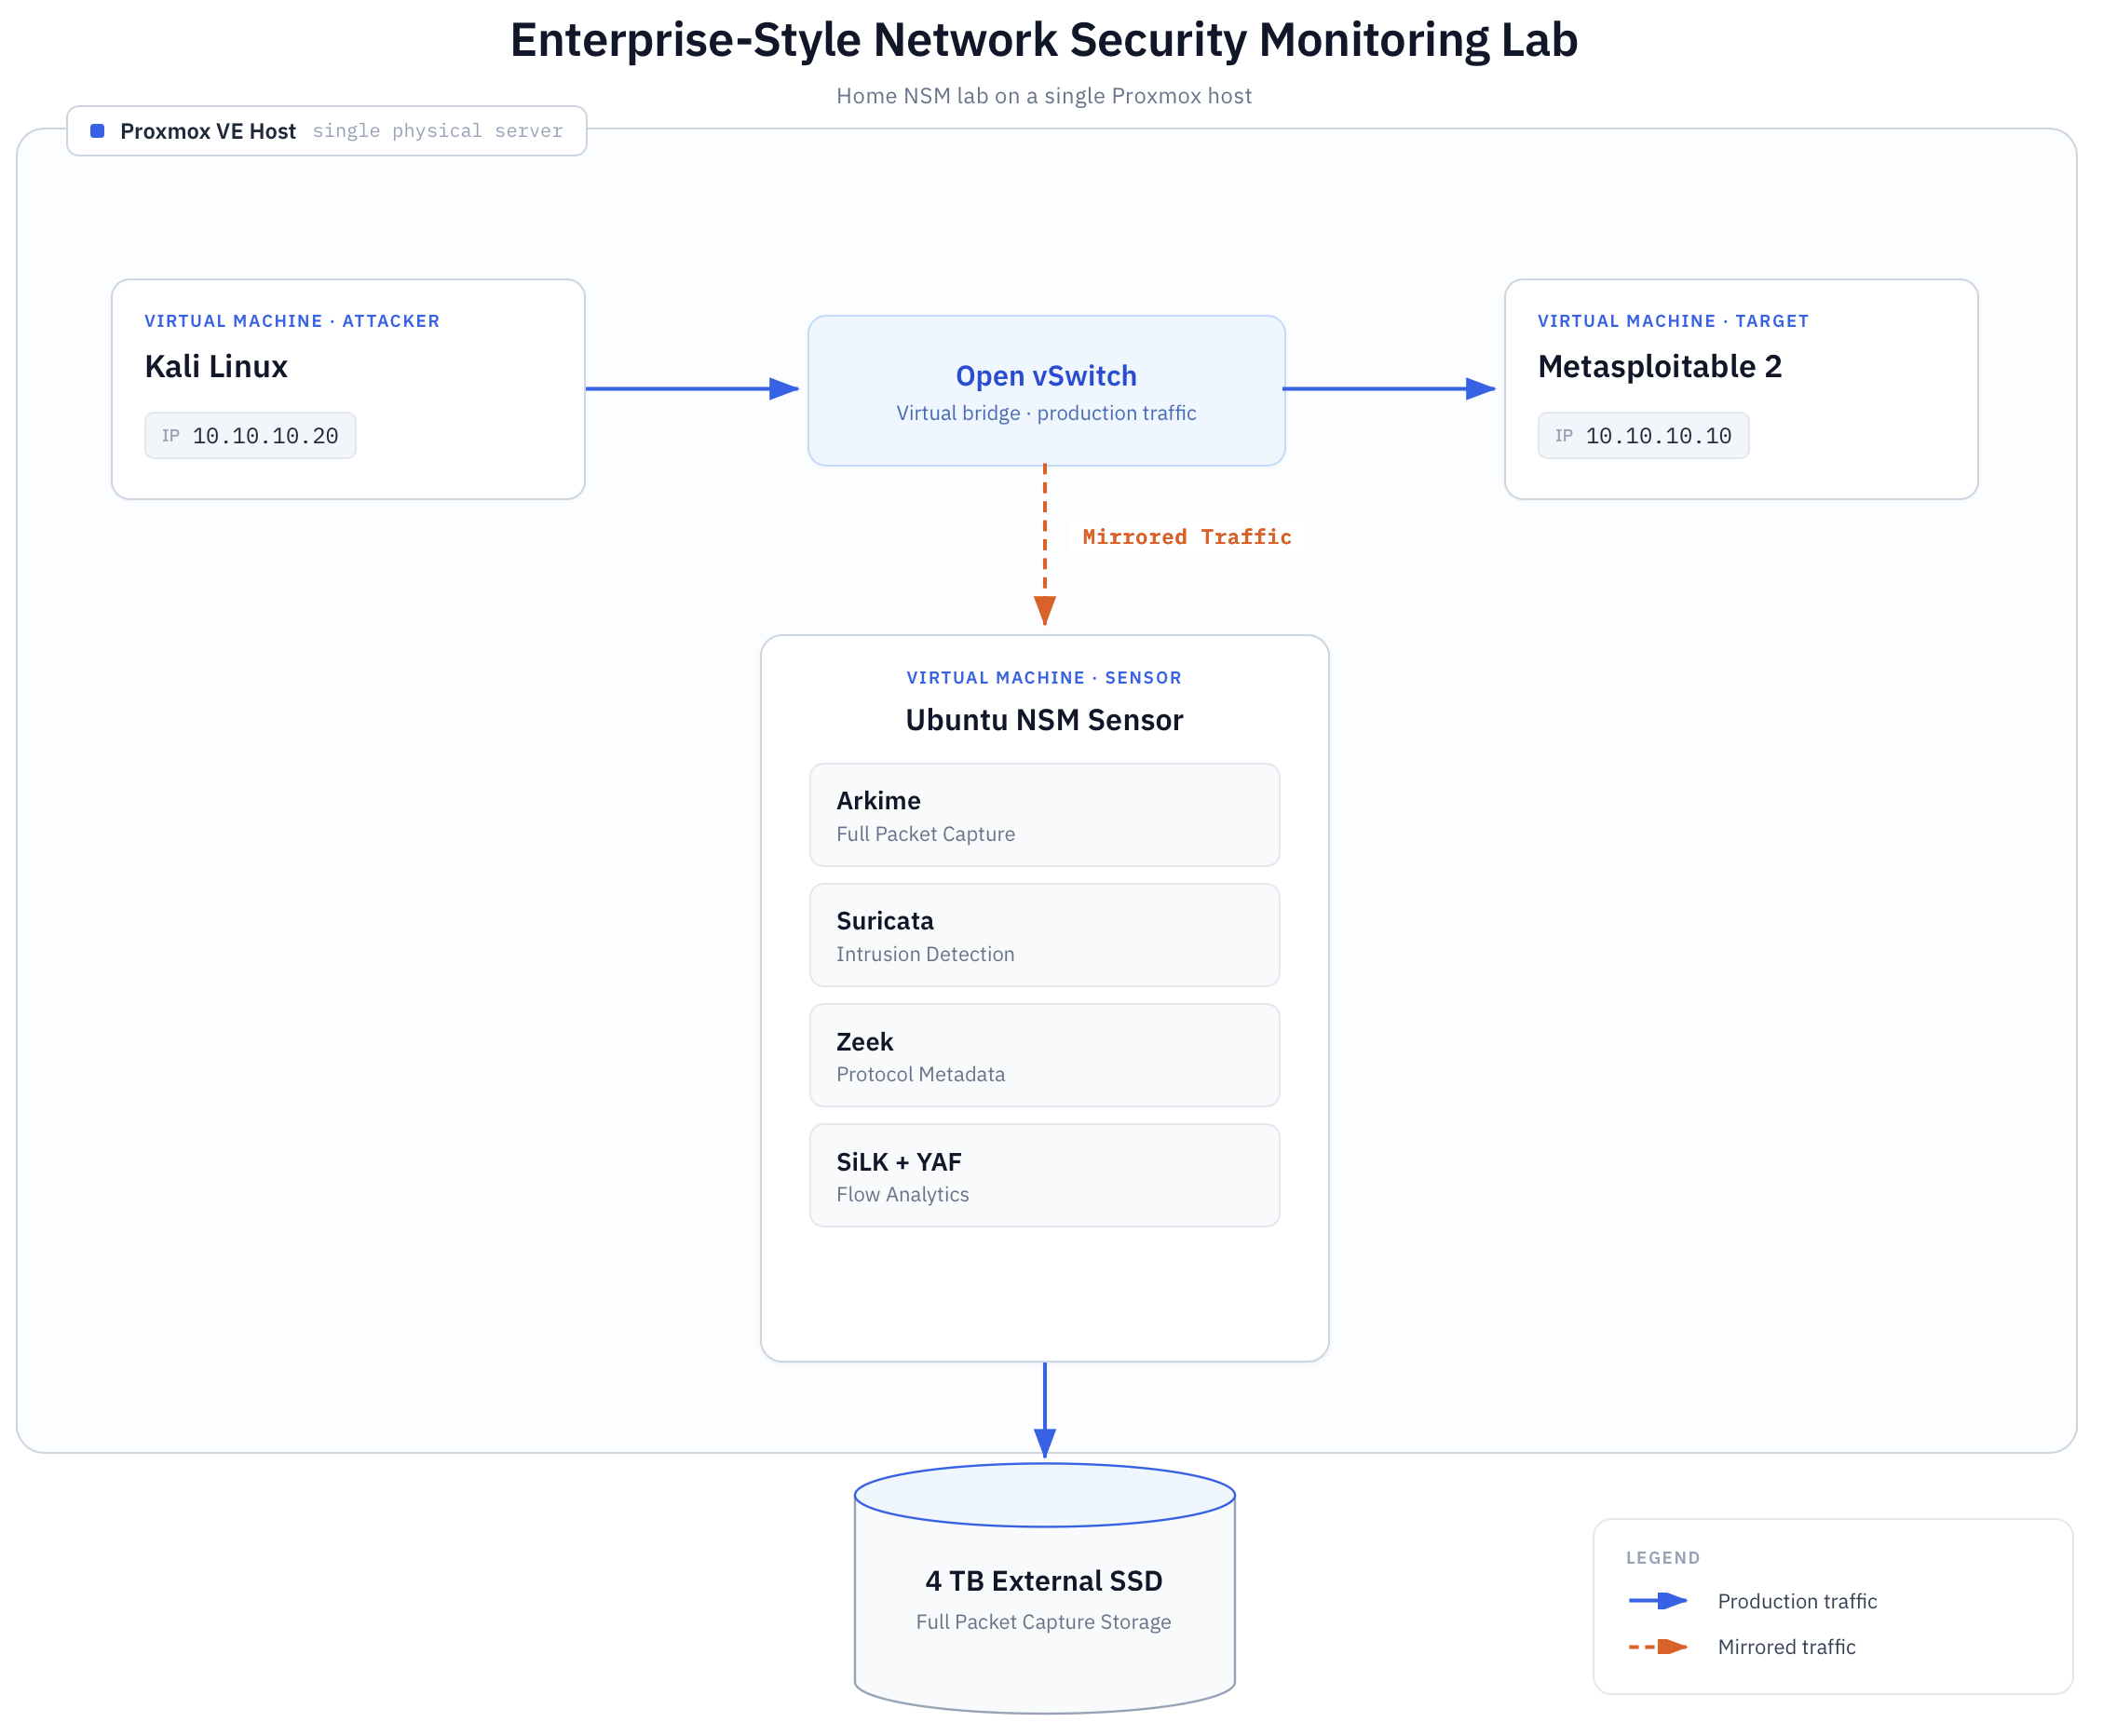
I intentionally limited the monitoring scope to the mirrored traffic exchanged between the Kali attacker VM and the Metasploitable 2 target VM. This provides a controlled environment for validating packet capture, intrusion detection, protocol analysis, and flow analytics before expanding the sensor to monitor additional virtual networks and lab systems. The architecture is designed to scale as new hosts and attack scenarios are introduced.
The sensor operates passively. Traffic never traverses the sensor directly. Instead, the Open vSwitch mirrors a copy of the traffic from the monitored virtual switch to the NSM sensor for analysis.
Figure 1 – Proxmox Virtual Environment
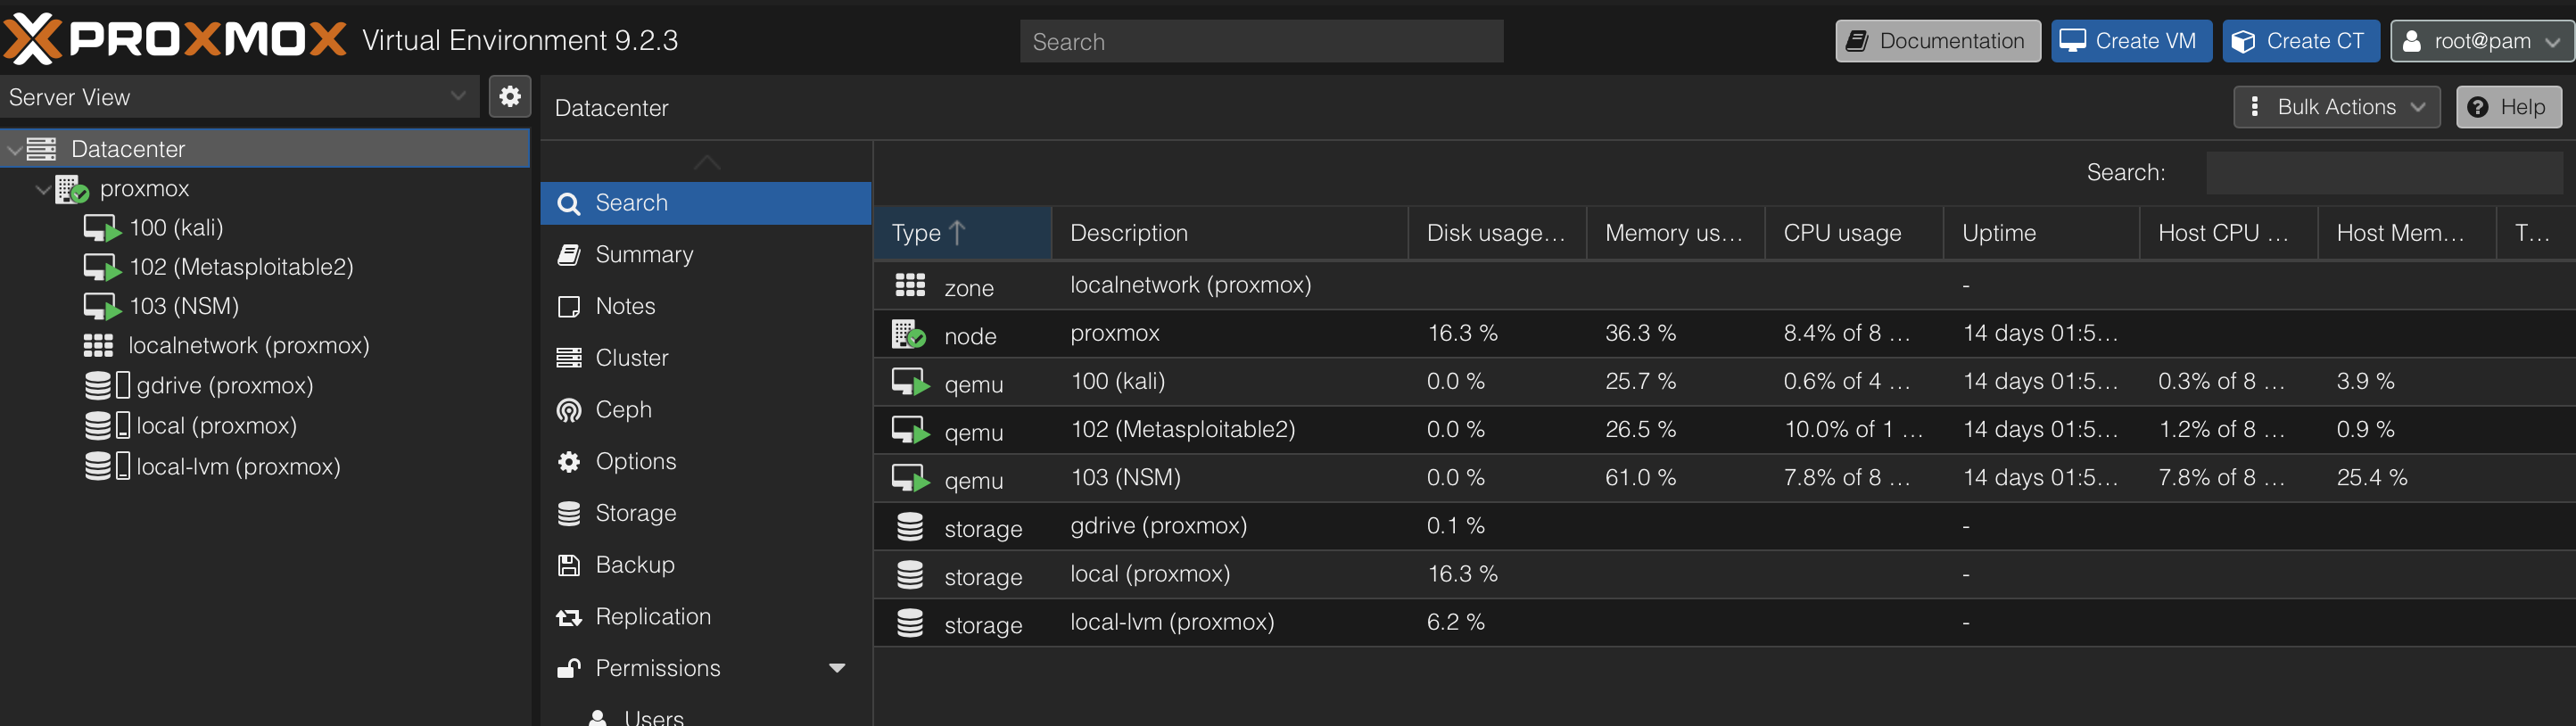
Figure 2 – Network Architecture
Technology Stack
Arkime
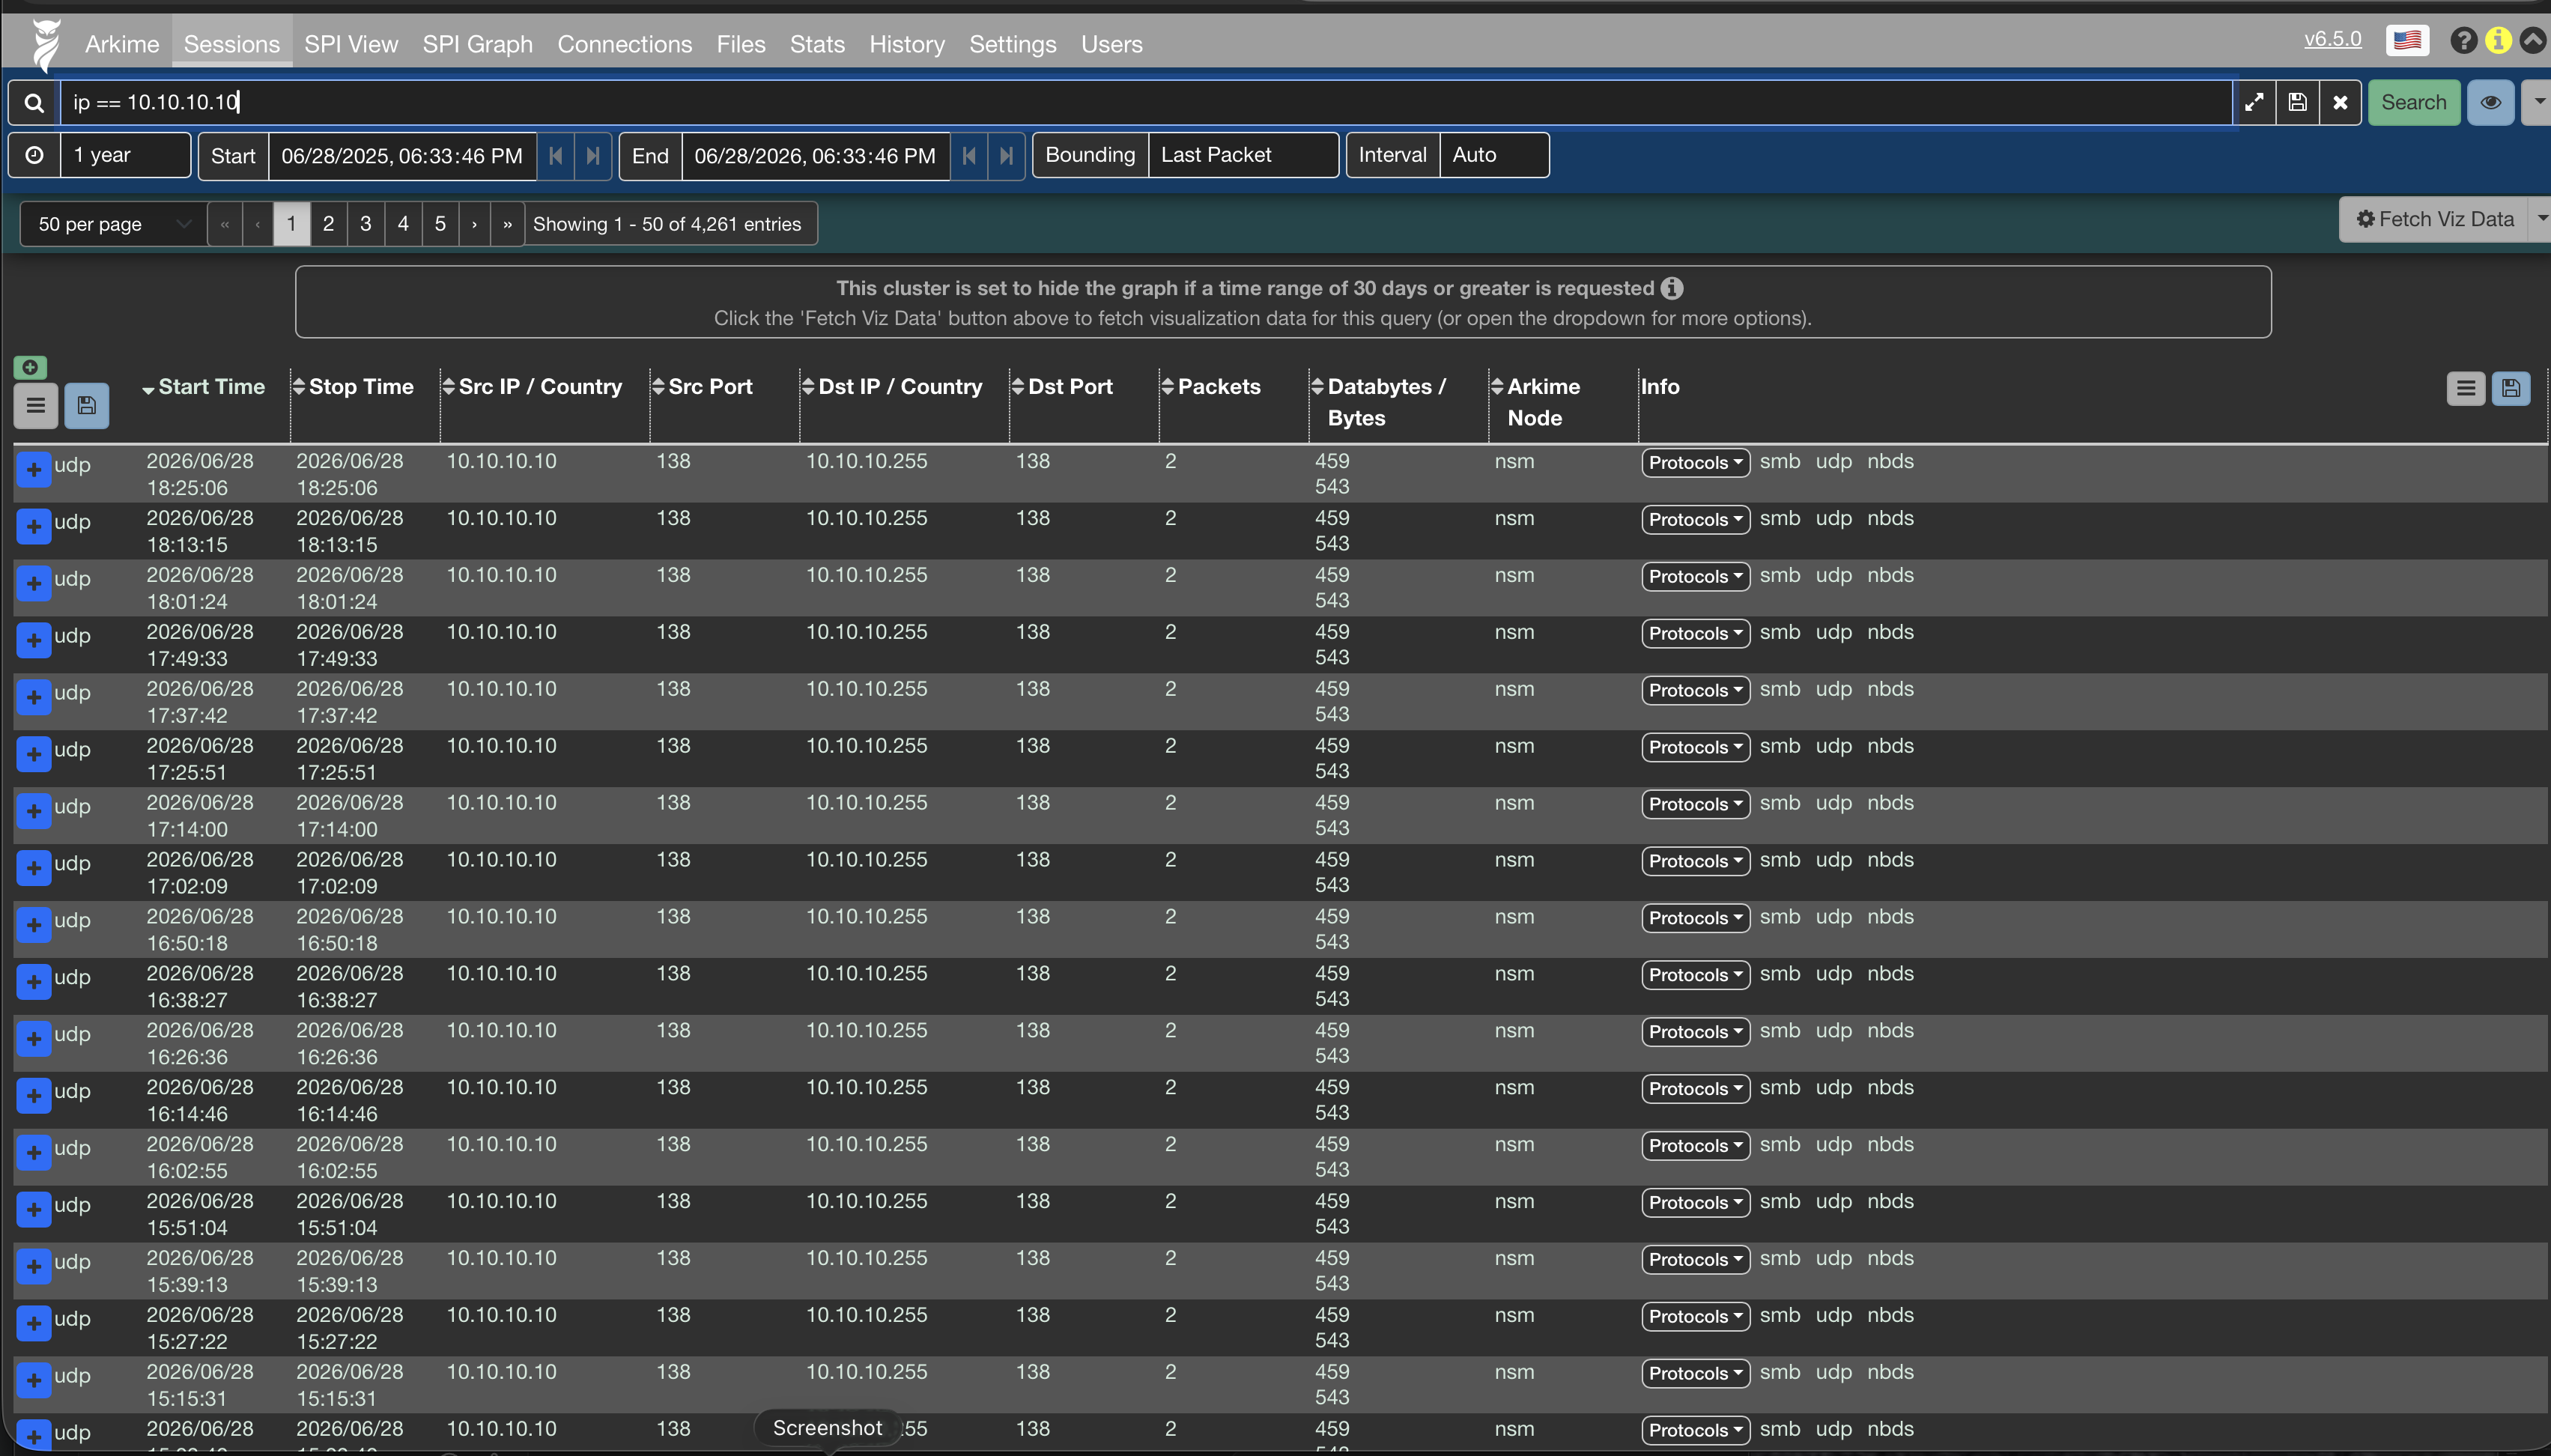
Arkime is the full packet capture platform.
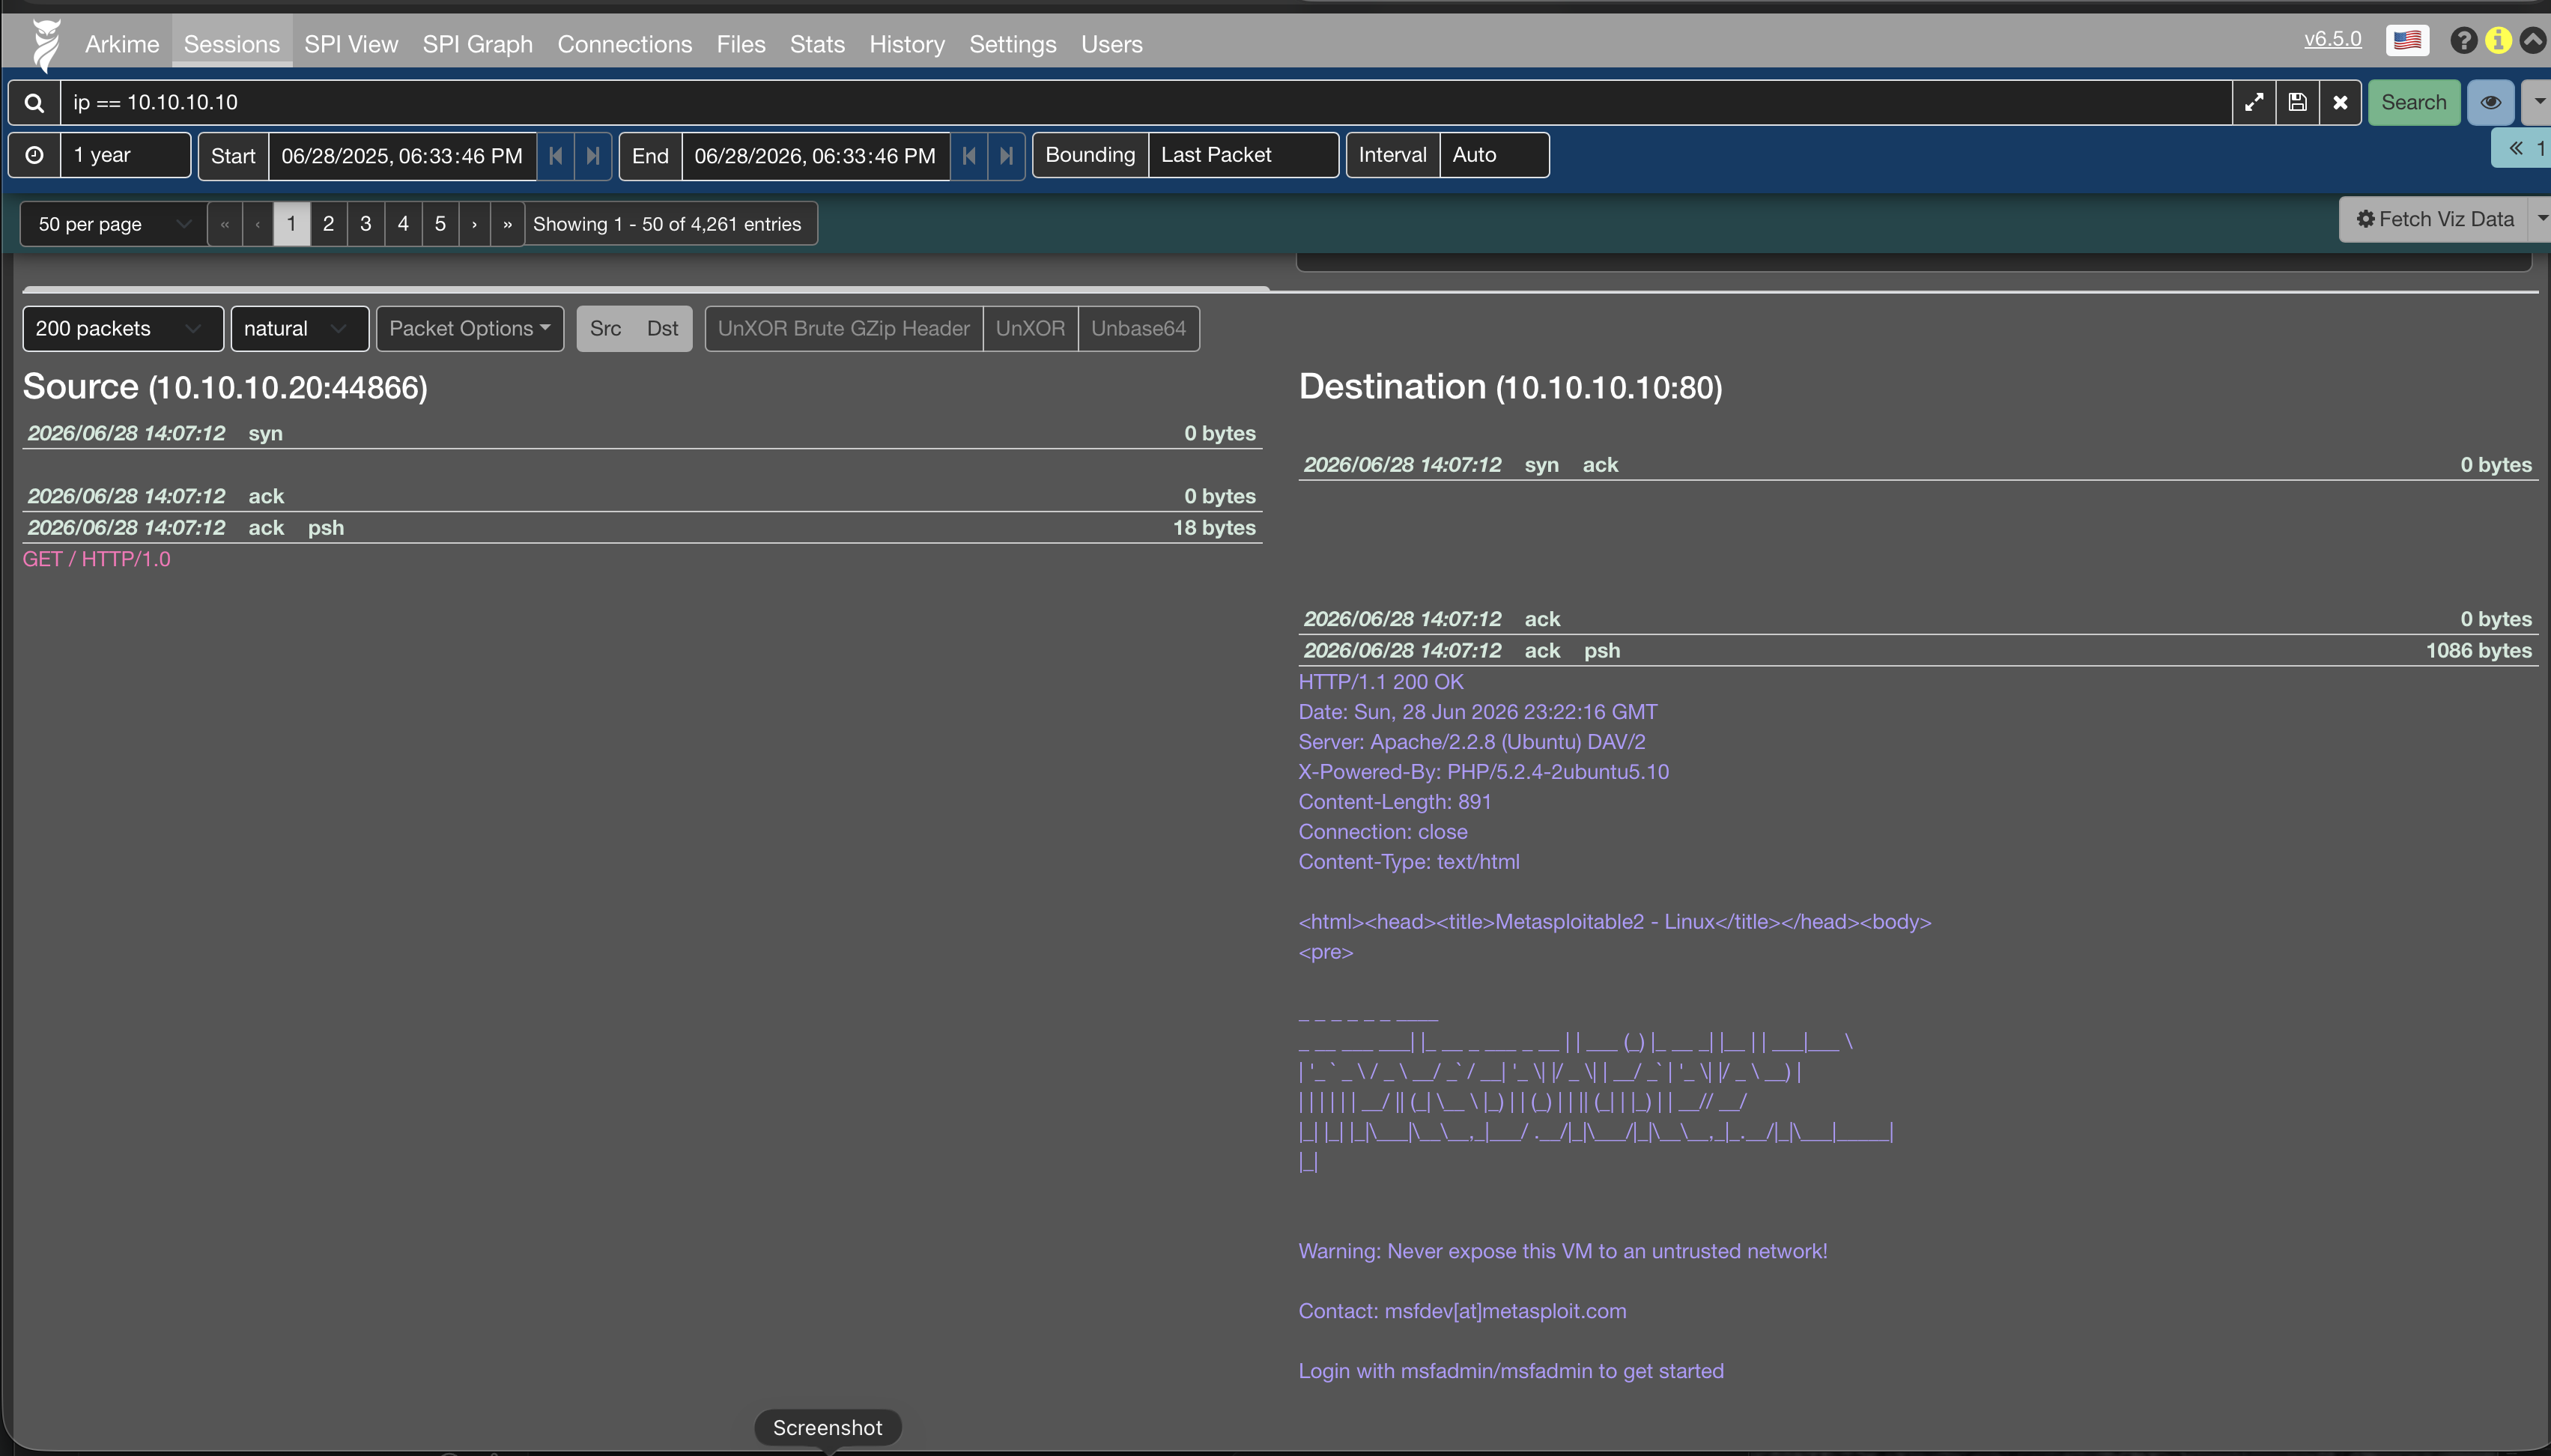
It continuously captures network traffic while indexing packets for retrieval during investigations. Unlike traditional packet captures that can be difficult to search, Arkime allows me to locate and reconstruct individual sessions within seconds.
Arkime provides:
- Continuous packet capture
- Packet indexing
- Session reconstruction
- Packet retrieval
- Web investigation interface
Rather than relying solely on IDS alerts, I can retrieve the complete packet history for any connection and inspect exactly what occurred on the wire (something that GCIA emphasized).
Figure 3 – Arkime Session
Suricata
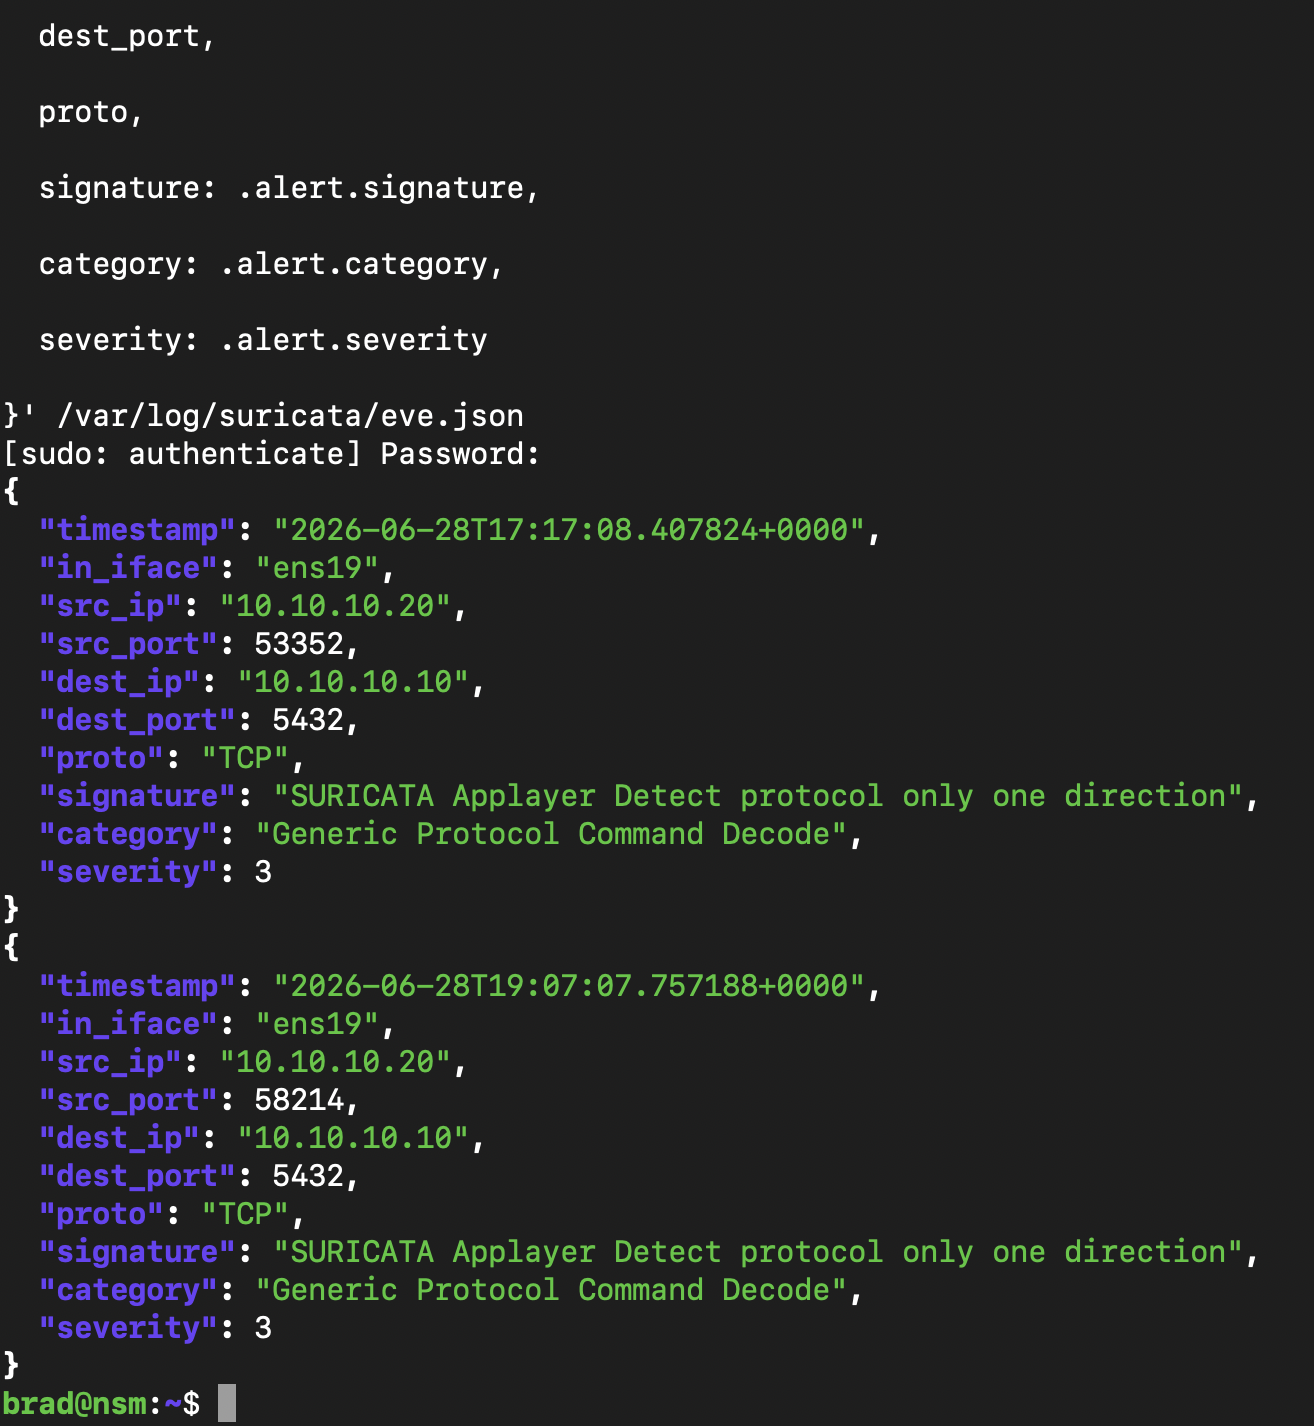
Suricata provides intrusion detection using the Emerging Threats ruleset while also performing protocol identification and application layer analysis.
During deployment I validated:
- HTTP detection
- SMB detection
- Protocol anomaly detection
- IDS alert generation
- Eve JSON logging
- Fast log output
One interesting troubleshooting issue involved Ubuntu naming the mirrored interface ens19, while my original Suricata configuration referenced eth19. After correcting the interface configuration, Suricata, to my great relief, immediately began processing mirrored traffic and generating alerts.
One of my future goals is to begin writing custom Suricata detection rules as I continue expanding the lab.
Figure 4 – Suricata Eve JSON Alerts
Zeek
Rather than running Zeek continuously, I chose to use it as an investigation platform.
Packet captures stored by Arkime can be analyzed with Zeek whenever deeper protocol visibility is required. This approach reduces CPU utilization while still providing access to Zeek’s rich protocol metadata during investigations.
Zeek generates logs such as:
- conn.log
- dns.log
- http.log
- ssl.log
- smb.log
- files.log
This allows me to examine protocol behavior without manually reviewing every packet in Wireshark.
SiLK
SiLK provides another important layer by converting packet captures into searchable flow records.
While Arkime captures every packet, SiLK summarizes communication into flow records that I can quickly search.
I spent considerable time working with SiLK during GCIA, but assembling the entire toolchain proved more challenging than I expected.
After compiling Carnegie Mellon’s latest release from source, I built the following pipeline:
PCAP
   ↓
YAF
   ↓
IPFIX
   ↓
SiLK Flow Records
This enables high-speed analysis using tools like:
- rwcut
- rwfilter
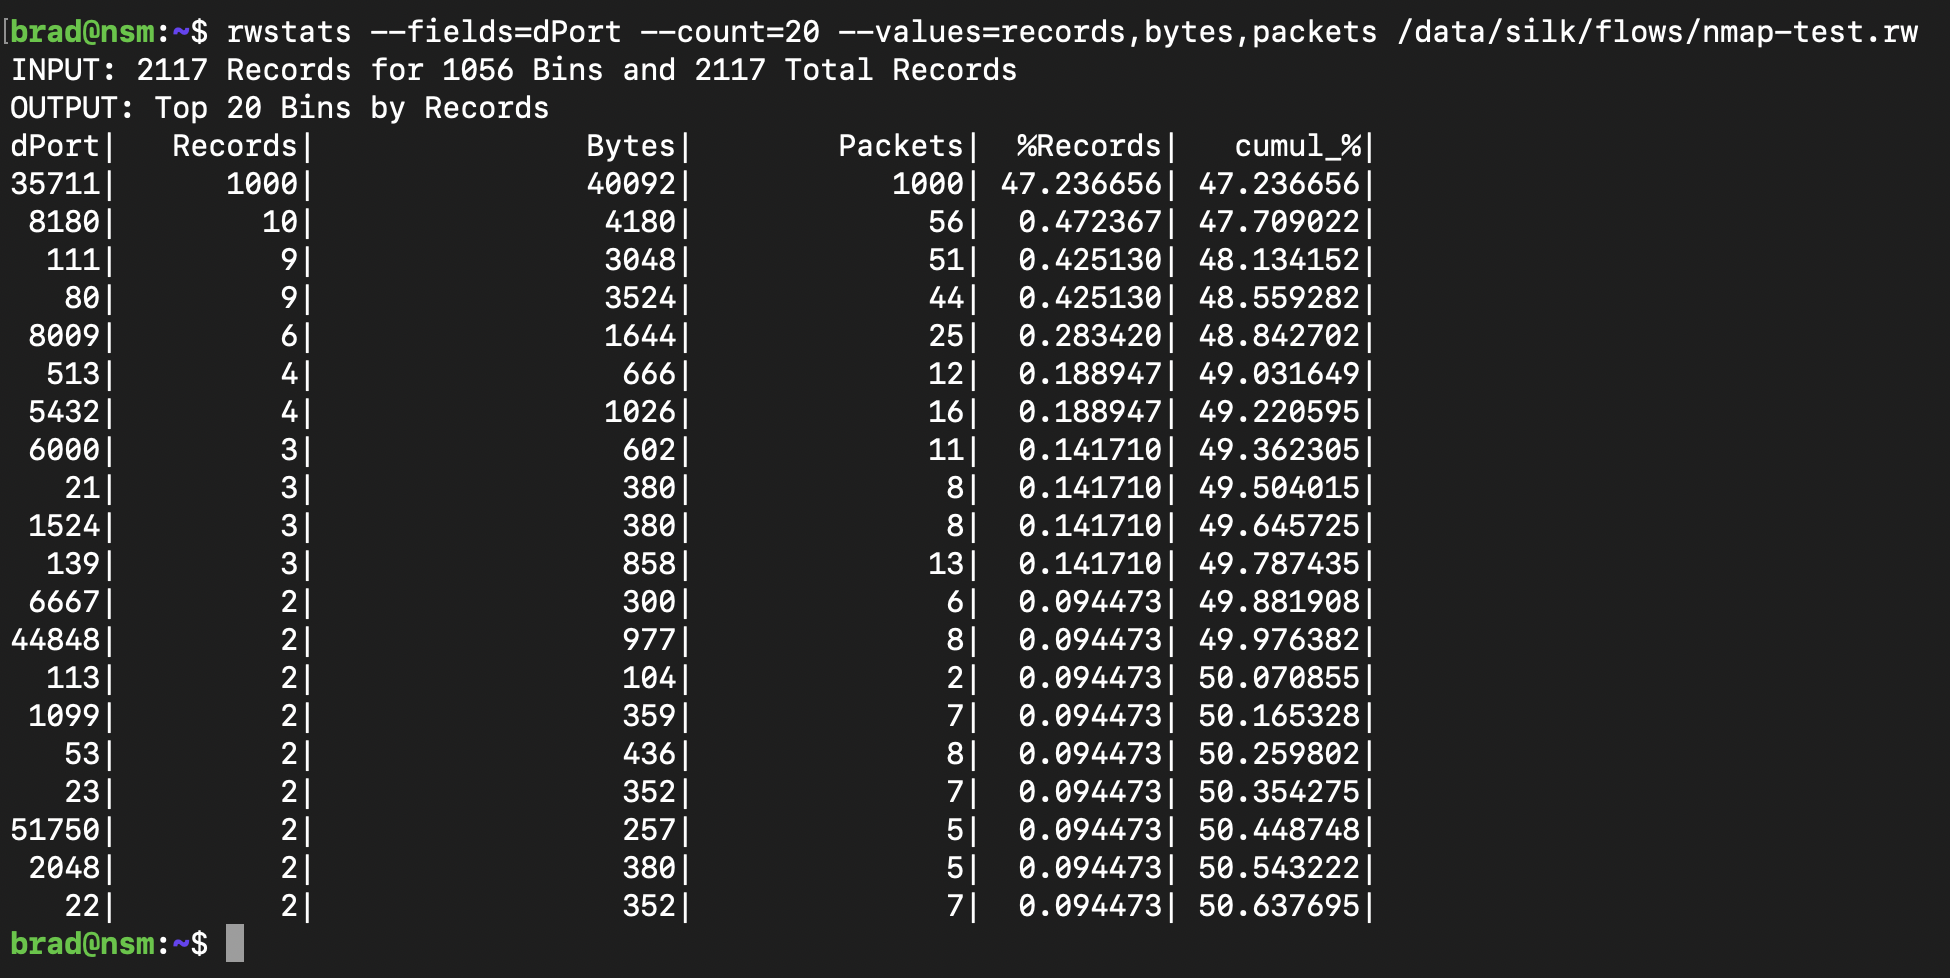
- rwstats
- rwfileinfo
Flow data complements packet captures by allowing analysts to identify scanning behavior, lateral movement, and communication patterns without first examining individual packets.
Figure 5 – SiLK Flow Records (rwcut)
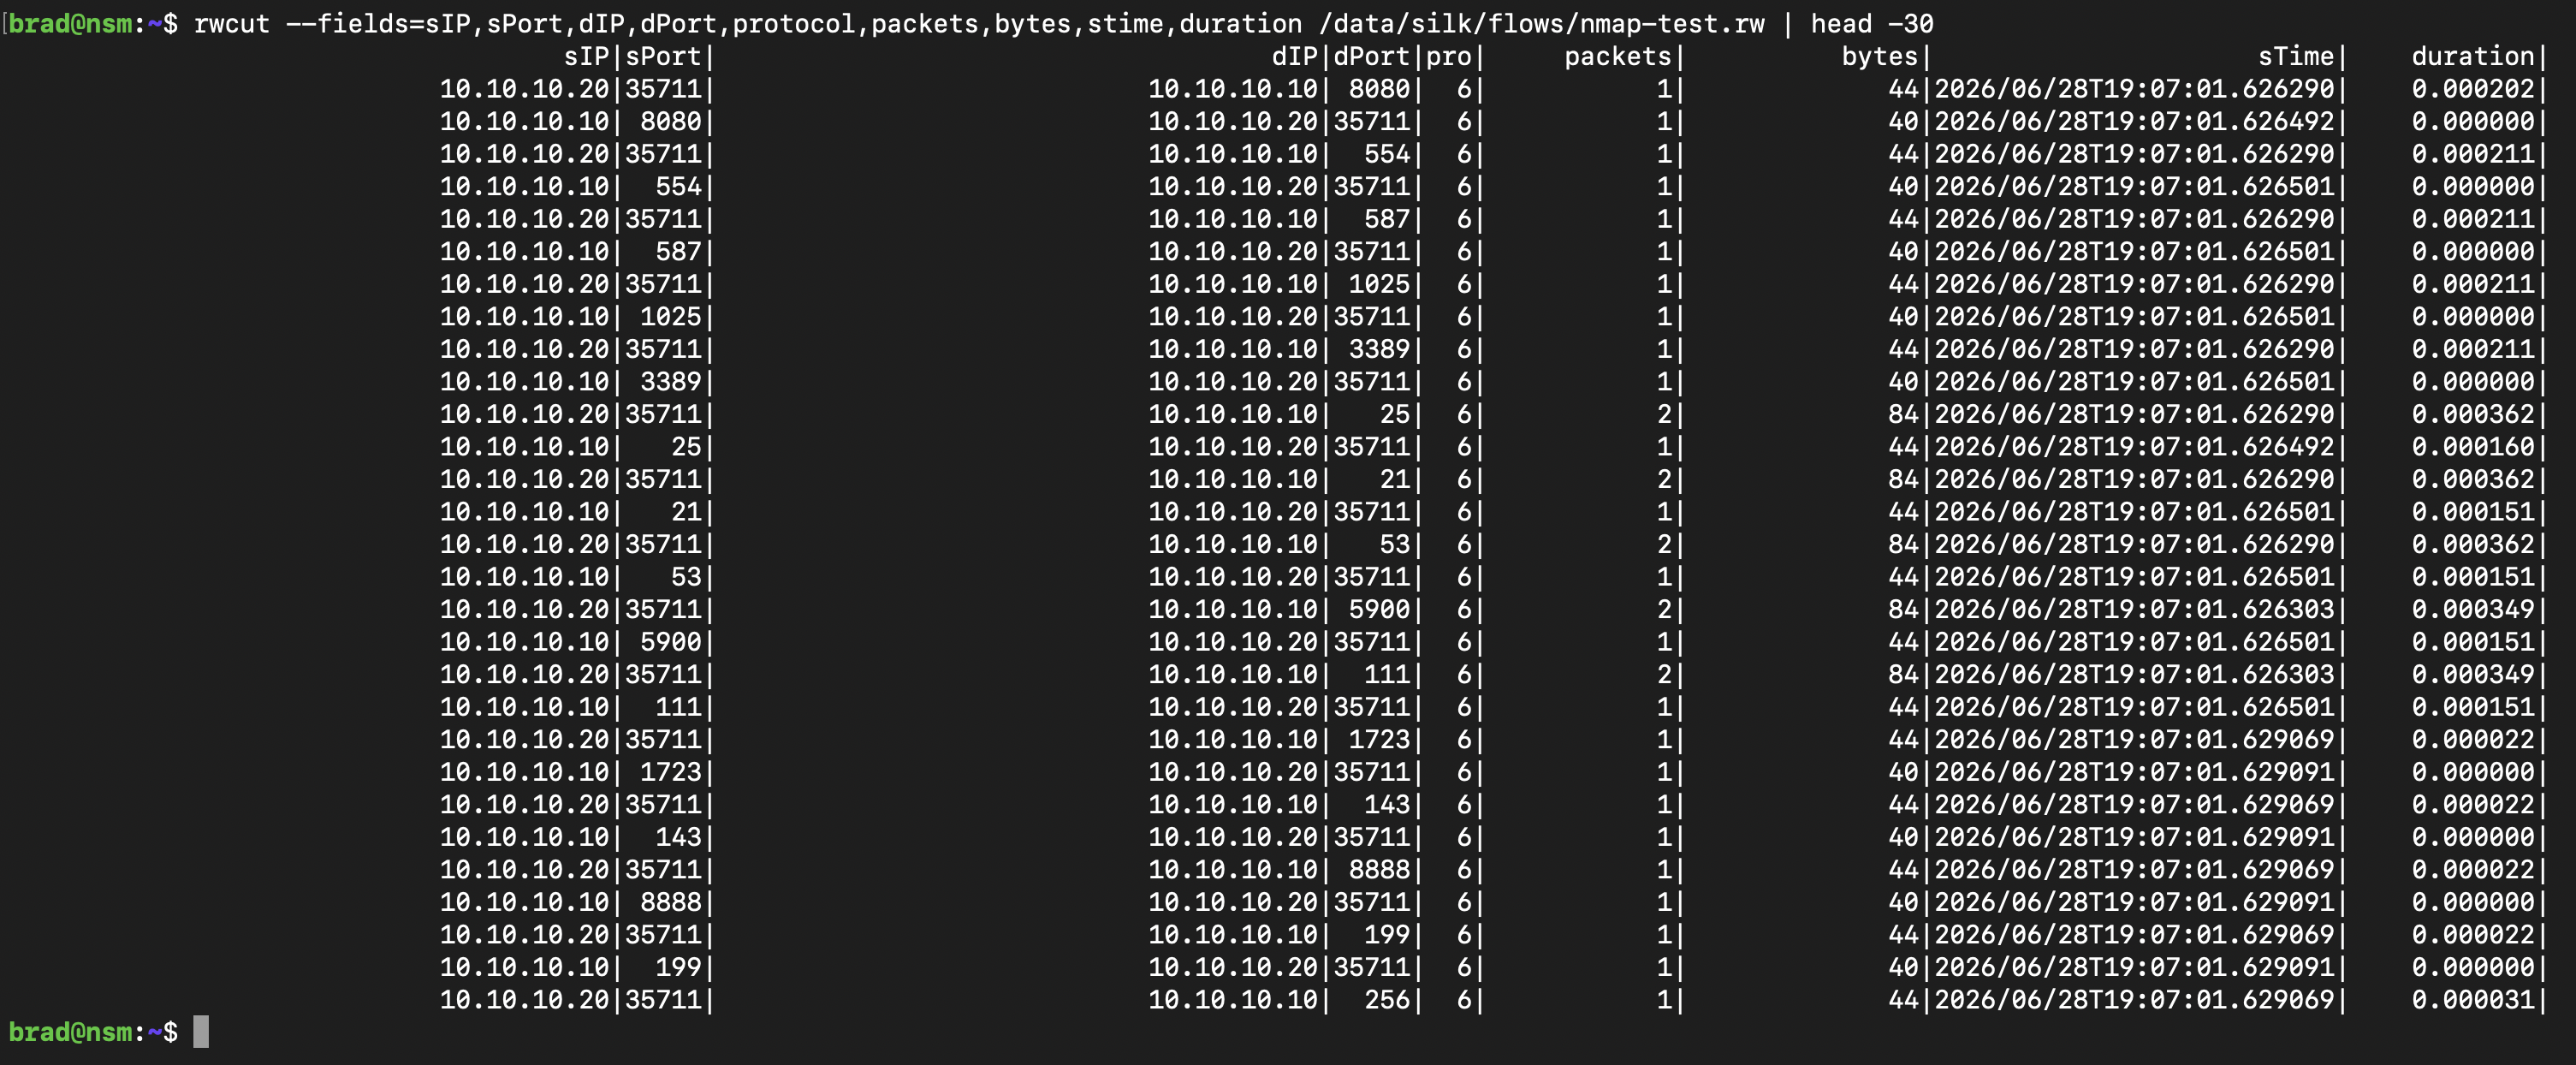
Figure 6 – SiLK Statistics (rwstats)
Traffic Validation
After deploying the monitoring platform, I generated test traffic from Kali Linux including:
- ICMP
- Nmap SYN scans
- HTTP requests
- SMB traffic
- Various TCP protocol connections
Rather than assuming the platform was working correctly, I independently validated each stage of the monitoring pipeline:
- tcpdump confirmed mirrored traffic reached the sensor.
- Arkime reconstructed captured sessions.
- Suricata generated IDS alerts.
- SiLK produced searchable flow records.
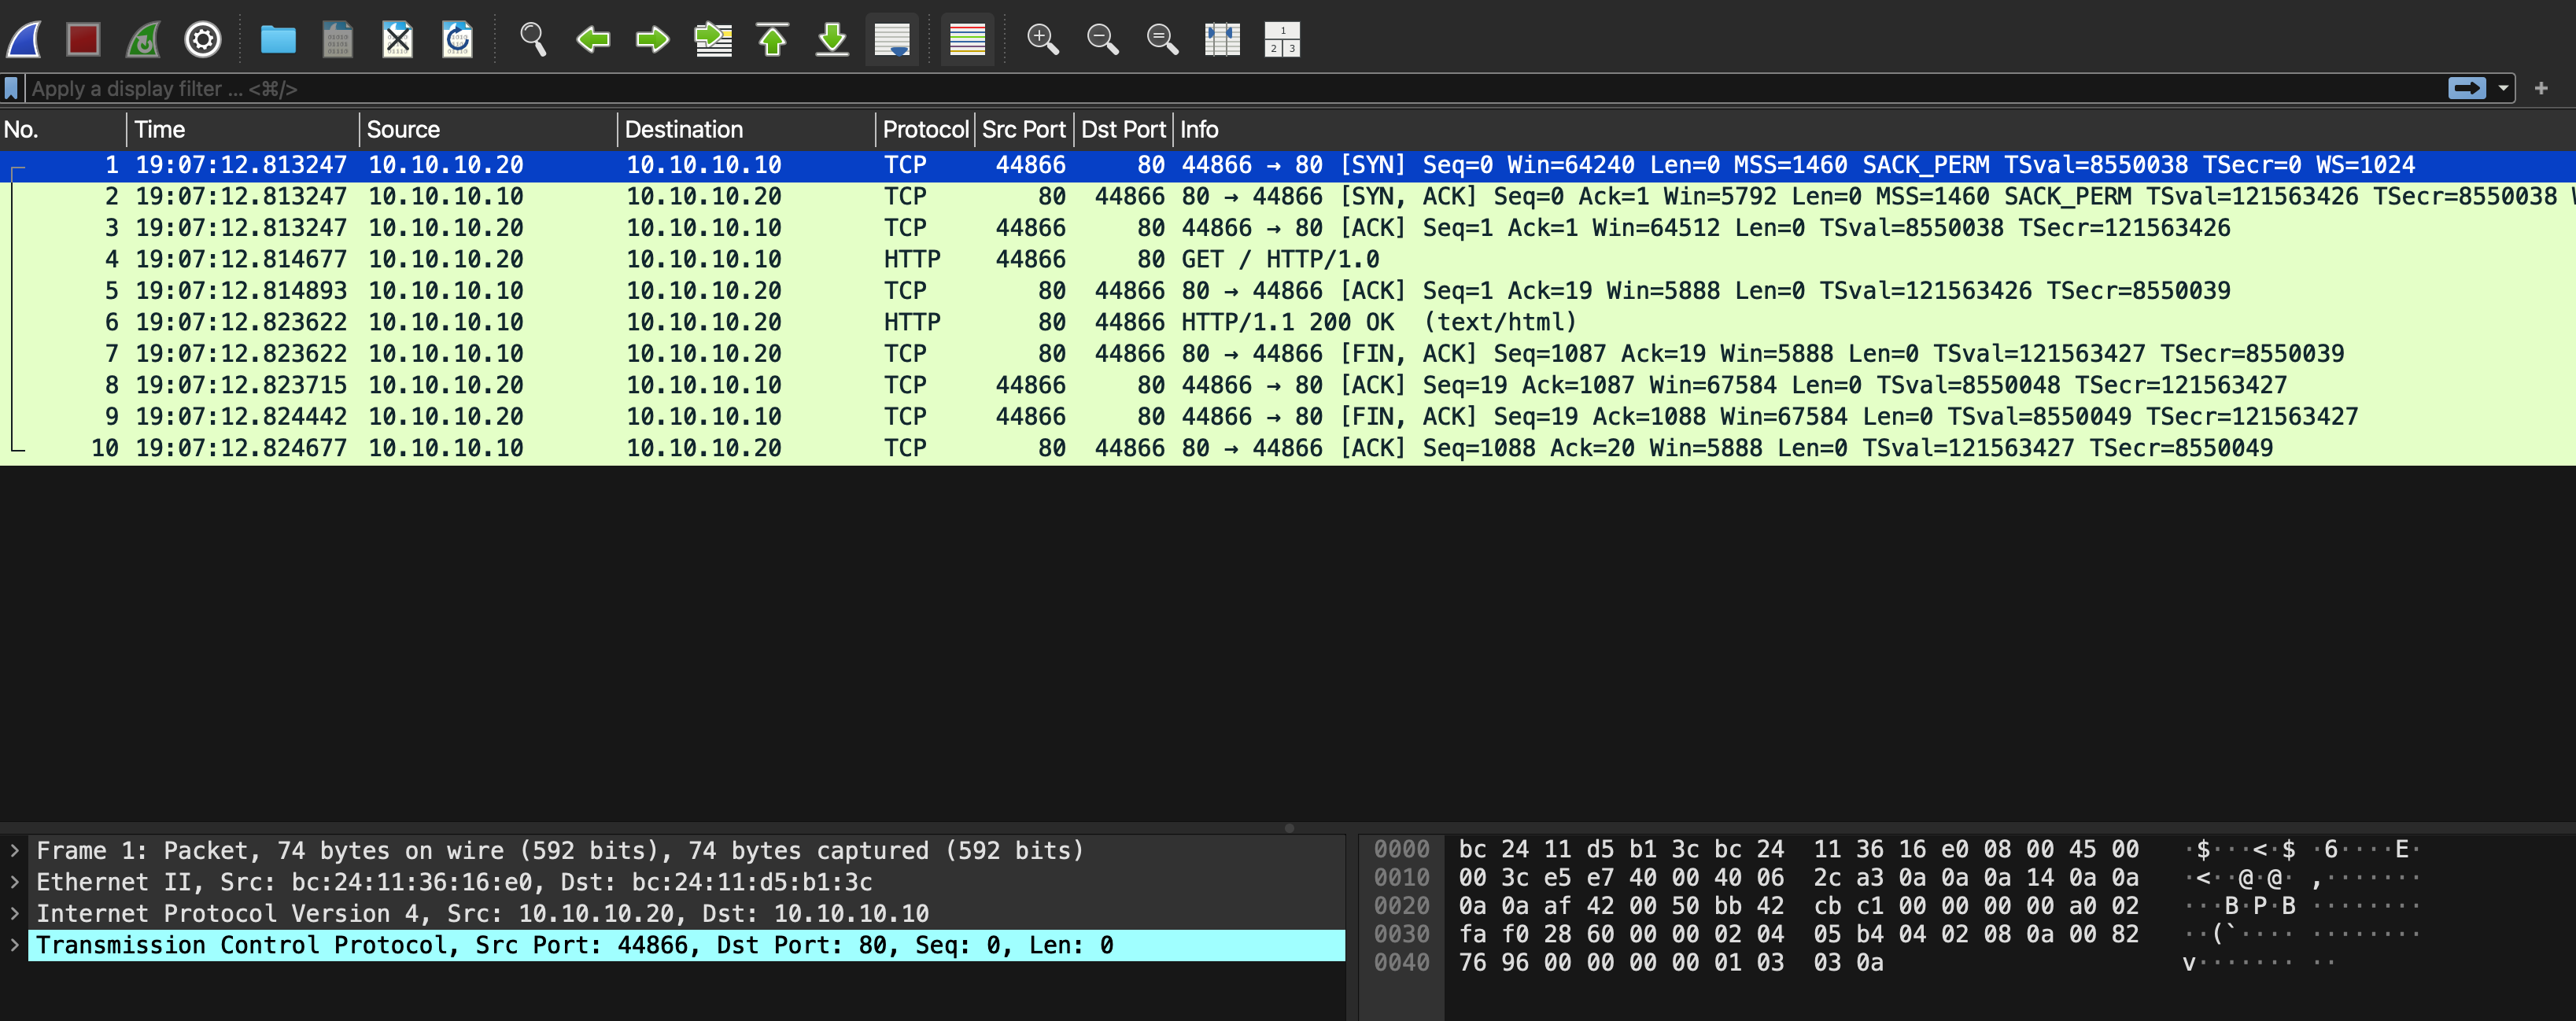
- Wireshark decoded the captured traffic.
Figure 7 – tcpdump Validating Mirrored Traffic

Figure 8 – Wireshark Verification
Challenges Encountered
One of the most valuable parts of this project was the troubleshooting process.
Some of the challenges included:
- Validating the open vSwitch mirror configuration
- Verifying packet capture with tcpdump before introducing additional tools
- Diagnosing incomplete packet captures
- Rebuilding portions of the Arkime configuration
- Resolving Suricata interface naming issues
- Compiling SiLK and YAF from source on Ubuntu 26.04
- Configuring SiLK site configuration files
- Understanding how YAF exports IPFIX and how SiLK converts those records into flow data
- Validating that every stage of the monitoring pipeline was functioning correctly
Lessons Learned
One of the major lessons from GCIA is that no single tool provides complete visibility into network activity.
Each component provides a different perspective on the same network activity.
| Tool | Primary Purpose |
|---|---|
| Arkime | Full packet capture |
| Suricata | Threat detection and IDS alerts |
| Zeek | Protocol metadata |
| SiLK | Network flow analytics |
Together, these tools provide multiple perspectives of the same network activity, enabling more effective investigations than any individual tool could provide alone.
Example Investigation Workflow
A typical investigation in my lab follows this workflow:
Nmap Scan

        │
        ▼

Arkime
(View full session)

        │
        ▼

Suricata
(Check IDS alerts)

        │
        ▼

Zeek
(Analyze protocol metadata)

        │
        ▼

SiLK
(Search large flow datasets)

        │
        ▼

Wireshark
(Deep packet analysis)
Each layer contributes context, allowing me to move from broad threat hunting to packet-level analysis.
Future Work
My lab will serve as the foundation for future projects involving:
- Malware traffic analysis
- Command-and-control detection
- DNS tunneling detection
- Lateral movement analysis
- Credential theft investigations
- MITRE ATT&CK mapping
- Threat hunting exercises
- Zeek scripting
- Custom Suricata rule development
Each of these topics will become its own portfolio article as the lab continues to evolve.
Conclusion
Building this platform reinforced that effective network investigations rely on multiple complementary sources of telemetry.
Packet captures, IDS alerts, protocol metadata, and flow records each reveal different aspects of the same network activity. Building, validating, and troubleshooting each stage of that pipeline gave me a much deeper understanding of enterprise network monitoring than simply deploying an all-in-one solution.
More importantly, the process reminded me that successful defenders don’t just use security tools—they understand how the underlying telemetry is collected, validated, and correlated during an investigation.
This project has become the foundation for future Blue Team research, and I look forward to expanding it through additional investigations and detection engineering projects.